GeoVis applies visual analytics to Multi-Dimensional GeoSpatial data
using Web World Wind for efficient GeoVisualization of massive climate data
Deployed within a high-performance Cloud visualization system. Providing simple yet configurable interface to automate the access of on-demand cloud resources.
Parallel GPU-enabled visualization engine. Parallel visualization is performed on a multi-GPU cluster using Compute Unified Device Architecture (CUDA).
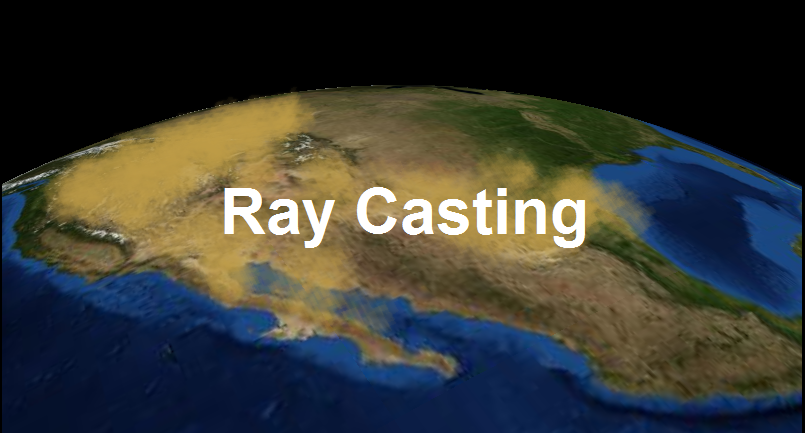
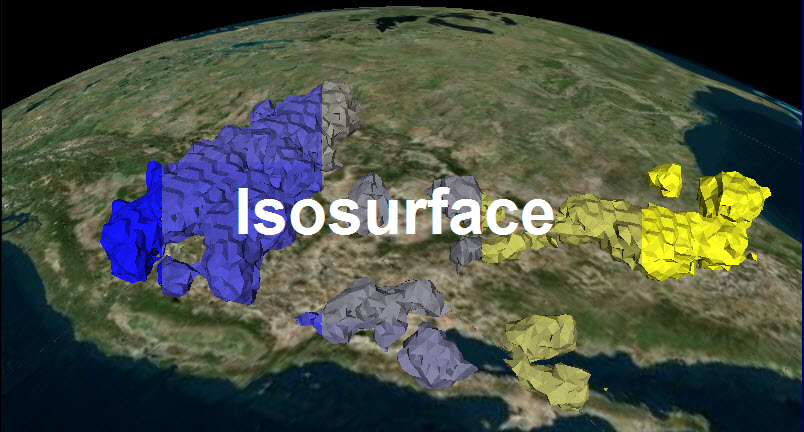
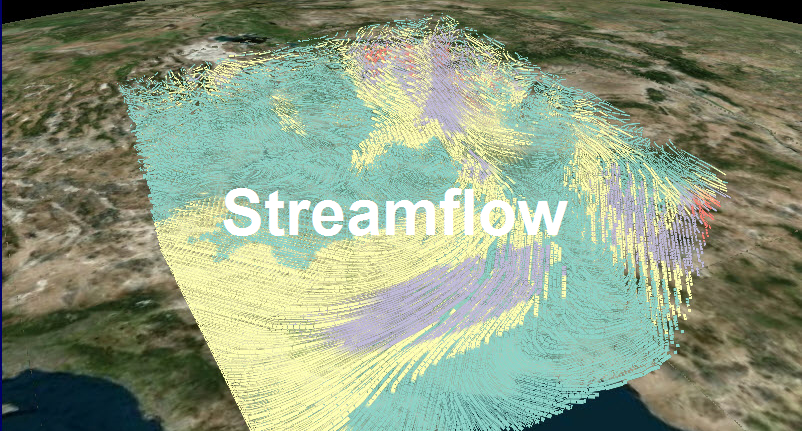
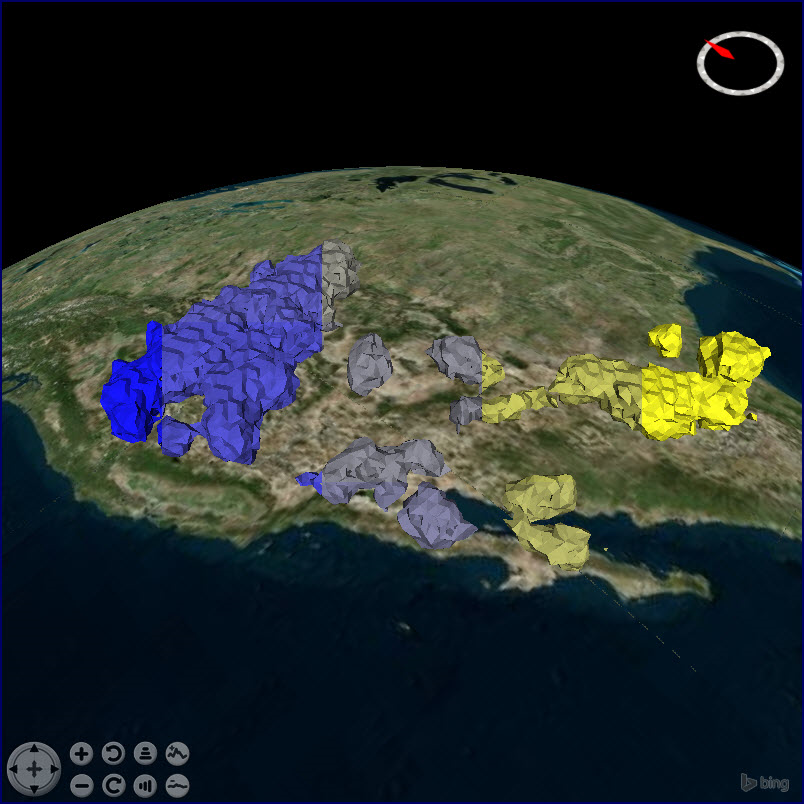
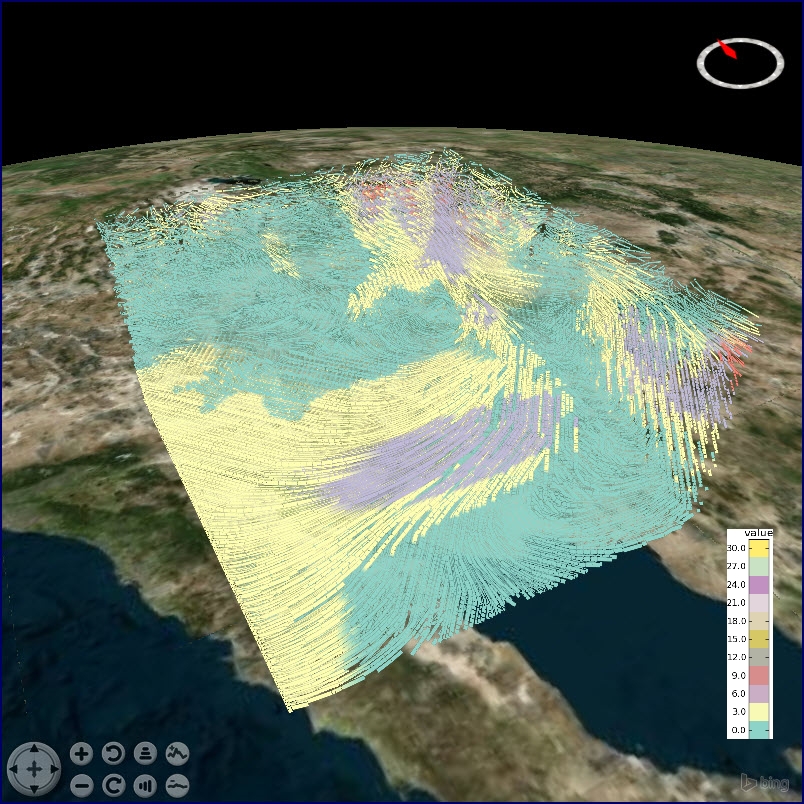
Providing GPU-accelerated 3D volumetric rendering and stream renderingalgorithms. Visualize large dataset with three dimensions: latitude, longitude, and time
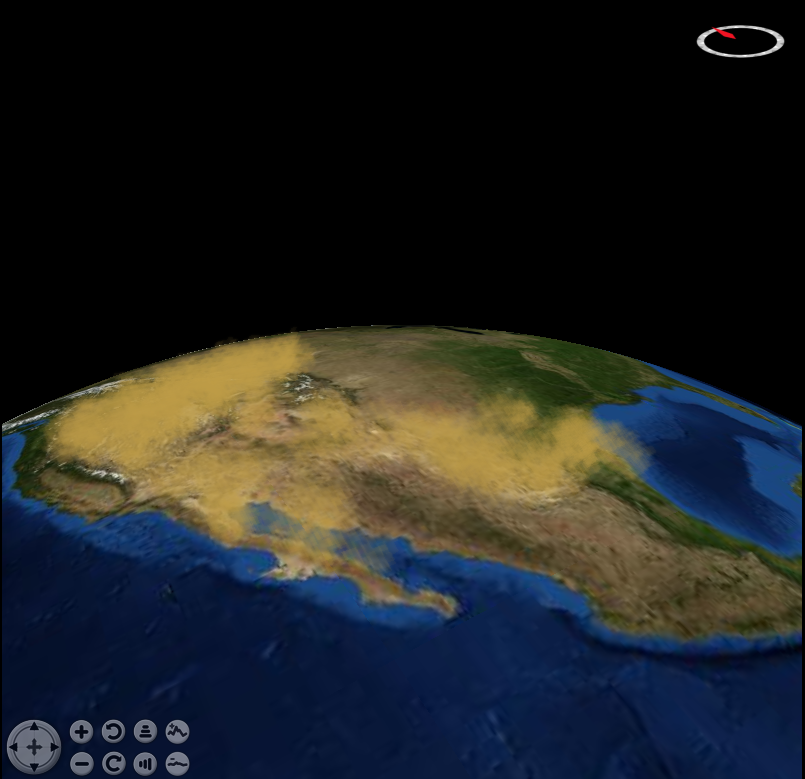
The dust storm dataset is produced from a regional climate model WRF-NMM (WRF: Weather Research and Forecasting, NMM: Nonhydrostatic Mesoscale Model; Huang et al. 2013). It is about 390M in size. The “dust” dataset contains the information of dust dry deposition load (μg/m2), dust wet deposition (μg/m2), total dust load (μg/m2), and surface dust concentration of PM10 aerosols (μg/m3) at four dimensions: latitude, longitude, time, and pressure. Scientists can exploit our remote visualization system to interactively examine the spatiotemporal variations of dust load at different pressure levels.
The atmospheric flow dataset is generated by the Dust REgional Atmospheric Model (DREAM) (Nickovic et al. 2001). The dataset was a result of a 72-hour dust condition simulation, from July 1st to July 4th, 2014. The simulation area is located in the Southwestern United States with a resolution of 0.027 degree (about 33km). The “flow” dataset contains the information of atmospheric conditions (e.g. precipitation, wind speed and direction), land surface conditions (e.g. soil moisture and temperature), and dust conditions (e.g. dust concentration, dust load).
To view the interface, please click on "OUR APP" button (the system's functions are disabled now . To perform realistic visualization tasks, please request Amazon instance by clicking the "Request Resource" button below).
Our AppPlease note the Amazon instances are only open to reviewers for operational cost reasons. If you are anonymous referee, please click the registration button below to let us know the journal you are reviewing, the number of requested instances, your preferred launch time. By default, we will allocate 1 hour of computing time for your test.
Please direct your any further questions to zhangt@whu.edu.cn, Jing.Li145@du.edu.
Thank you for your precious time and we look forward to your valuable comments.
Please contact us with any questions.